Exploring Olympic Data 1896-2016 through Explanatory Data Analysis

Develop Project Proposal
1. Description
As a scientist in the Sport field, we are asked to do deep analysis which will be focused through data visualization. The analysis will find out any trends in olympics games such as the country that dominating in certain sports for 120 years and qualitative analysis to answer the question why this phenomenon happens. Further, our journey steps to the side of statistics with regression problem to estimate the missing value in certain variables. It’s interesting to find out specific, righful, and useful regression method to handle this problem.
2. Questions
To ensure the effectiveness of the research, the following question will be answered systematically:
- How does data pre-processing will be developed?
- What kind of methods is more useful to handle and fill missing value in the certain columns?
- Are there unique trends visually in the data?
3. Assumptions
The scopes of research are listed:
- Each rows is the unique person in difference time of period
- The chosen columns must have high correlation
4. Approaches
To answer the questions that the author mentioned in the previous section, the following methods and approaches will be considered:
- Several columns will be dropped because it has no enough correlation with the main analysis
- To handle missing value, the linear regression, decision tree regressor, and support vector regression will be compared
- Evaluation metrics use root mean square error, mean absolute error, and pearson correlation
- Explanatory Data Analysis (EDA) is rightful method and mostly used to find out pattern in the whole data
Prepare the Proposal
1. Which client/ dataset did you select and why?
- Client: Sport Stat Olympics Data
- Why: get insights of athletes characteristics in the world based on the olympics data
2. Describe the steps you took to import and clean the data
- Import the data
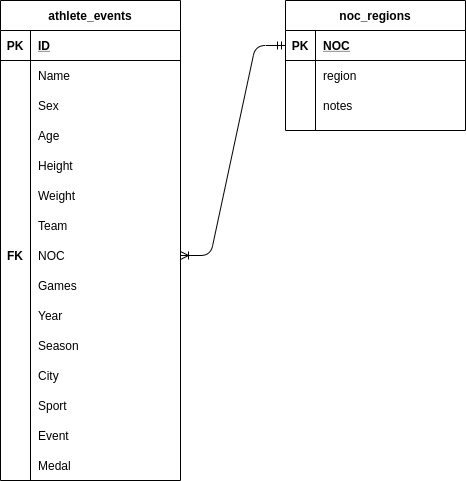
- Join the data using NOC variable
- Data pre-processing (athlete event)
- Height and Weight using available data
- Fill the ge using linear regression (Height and Weight) only if it’s significant or having high correlation
- Fill missing value in variable of Medal with null
- Create new column to identify if athlete got medals of not
3. Initial exploration of data and provide some screenshots or display some stats of the data you are looking at.
- Athletes who get more than one medal in their competition
- Scatterplot between Height and Weight (coloring with Sex)
- Nation domination in each sport over the data
4. Entity Relationship Diagram
Result